All published articles of this journal are available on ScienceDirect.

Process Simulation and Evaluation of Carbon Separation Technology from High-CO2 Gas Wells in Indonesia Using a Solvent and Adsorbent
Abstract
Background
With the global shift towards cleaner energy, natural gas demand is rising due to its lower environmental impact compared to oil. The gas reserves of Indonesia, notably in fields, such as Masela, Jambaran Tiung Biru (JTB), and Natuna, often have high CO2 content. Effective CO2 separation is vital to meet commercial gas standards while minimizing energy consumption.
Methods
This study evaluates the energy efficiency of two established CO2 separation technologies: absorption using MEA solution and adsorption with a carbon molecular sieve. Both methods were simulated in Aspen software to assess energy requirements across different gas fields.
Results
Adsorption showed superior energy efficiency in all fields. For Masela (93% recovery), adsorption required 3.63E+03 GJ, significantly lower than absorption’s 2.46E+04 GJ. In JTB (95% recovery), adsorption consumed 1.43E+03 GJ, outperforming absorption’s 2.75E+04 GJ. For Natuna (93% recovery), adsorption used 1.37E+04 GJ versus absorption’s 3.49E+05 GJ. CO2 concentration emerged as a key factor in separation efficiency; adsorption was most effective at moderate CO2 levels, such as JTB’s 35%. However, low CO2 levels (10%) in Masela reduced adsorption efficiency due to incomplete saturation, while high levels (71%) in Natuna led to rapid adsorbent saturation.
Conclusion
Adsorption demonstrated greater energy efficiency across varying CO2 concentrations, though it performed best at medium levels. Absorption efficiency declined at higher CO2 concentrations, limiting its suitability for gas fields with high CO2 content. These findings highlight the potential of adsorption for more energy-efficient CO2 separation in the gas fields of Indonesia.
1. INTRODUCTION
The global energy demand is predicted to increase significantly in the coming years and is currently dominated by fossil fuels, including coal, oil, and gas [1]. However, this reliance on fossil fuels has led to a significant rise in CO2 emissions, contributing to global climate change. To address this, a global energy transition toward renewable energy has emerged, aimed at reducing CO2 emissions in the atmosphere. During this transition era, natural gas plays a crucial role as a cleaner energy source across various sectors, such as power generation, industry, and transportation, emitting less CO2 and offering higher energy efficiency compared to coal and oil.
To support the energy transition, natural gas exploration has been ramped up. According to the Global Energy Review 2019, international demand for natural gas is expected to increase by 40% between 2018 and 2050. The composition of natural gas produced from wells is influenced by factors, such as location, type, depth of the deposits, and regional geology, according to Jasim et al. [2]. Raw natural gas primarily contains methane (CH4) along with smaller amounts of ethane, propane, butane, and heavier hydrocarbons, as well as non-hydrocarbon components like carbon dioxide (CO2), hydrogen sulfide (H2S), water (H2O), nitrogen (N2), and other residual components. The purification of raw natural gas is necessary to meet pipeline specifications and environmental regulations, according to da Cunha et al. [3].
Natural gas processing typically involves four main steps: pretreatment, acid gas removal, dehydration, and liquefaction. Pretreatment removes unwanted substances through separation units that are also capable of separating gas from oil and water phases. Before further processing in dehydration and liquefaction units, acid gases, such as H2S and CO2, must be removed using separation processes, according to Poe and Mokhatab [4]. The presence of CO2 in natural gas, particularly when combined with water, can cause corrosion in pipelines and equipment, reduce the calorific value of the gas, and even lead to crystallization during the liquefaction process, according to Nasir and Iran [5].
However, significant challenges remain, particularly due to the high variability in CO2 content in natural gas reservoirs, which complicates separation and purification processes. Significant variations in CO2 content have been observed in natural gas worldwide, with CO2 levels ranging from 4% to 50% in raw natural gas and even reaching 71% in some cases, such as in the Natuna gas field, according to Murbini [6]. While high CO2 content in natural gas poses processing difficulties, it also presents opportunities for utilization, such as enhanced oil or gas recovery or underground storage. Although these applications fall outside the scope of this paper, they have been addressed in other studies.
The variation in composition, pressure, and temperature of natural gas determines the most suitable carbon removal technology, as noted by Iran & Chem [5]. No single technology is ideal for all conditions, so an effective process design should consider various technologies and select the most efficient option [7]. Although several evaluation and analysis studies have investigated these processes separately or compared them for specific applications, specific assessments of absorption and adsorption for high-CO2 gas wells are scarce in the literature. The study by Anselmi et al. [8] compared the three CO2 separation technologies, but with a maximum CO2 content of 9%, focusing on air-CO2 separation. They found that absorption had the highest recovery and purity levels, although it also had the highest energy consumption.
Therefore, the novelty of this study lies in the comparative evaluation of solvent- and adsorbent-based CO2 separation technologies, specifically applied to the high-CO2 gas wells of Indonesia, characterized by their distinct composition and operating conditions. By simulating both technologies in Aspen, the study identifies adsorption as the more energy-efficient method across all fields, highlighting its superior performance at medium CO2 concentrations. This comparative analysis offers new insights into optimizing CO2 separation technology based on field-specific gas composition, which is critical for enhancing energy efficiency in Indonesia's growing natural gas sector.
2. GAS FIELD DATA
This study uses data from three natural gas fields in Indonesia, each with different compositions and operating conditions, as outlined in Table 1, to determine which technology is most suitable for each set of operating conditions.
Since the dominant components in natural gas composition are CH4 and CO2, the simulation for absorption and adsorption can assume that the feed gas is a binary mixture. This simplification to a binary mixture is also intended to reduce the complexity of the adsorption simulation, allowing the use of a single adsorbent layer. The normalized gas composition and flow rates, which will serve as the inlet parameters for the absorption and adsorption simulations, are shown in Table 2.
3. METHODOLOGY ABSORPTION SIMULATION MODEL
3.1. Absorption and Thermodynamic Model
The most common and proven method for removing CO2 is through the absorption process in a solvent containing amine, followed by desorption. The simplest and most used amine for CO2 removal is MEA (monoethanolamine). In its application, MEA concentration is limited to 30% due to its corrosive nature.
In the study by Luo and Wang [12], the PC-SAFT EOS was used to calculate vapor phase properties, and the eNRTL method was used to model the electrolyte system of the MEA-H2O-CO2 mixture. Most of the eNRTL model parameters used in that study were obtained from the SRK-ASPEN databank, and some were updated by recent studies through regression using new experimental data.
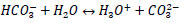
The liquid-phase chemical reactions involved in the MEA-H2O-CO2 system can be expressed as follows:
R1: water dissociation
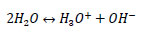 |
R2: dissociation of CO2
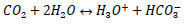 |
R3: dissociation of carbonate
 |
R4: dissociation of the protonated amine
 |
R5: carbonate formation
 |
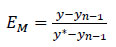
The traditional method for modeling absorption columns is by using equilibrium methods. Each stage can be calculated by assuming equilibrium between the CO2 concentrations in the gas and the liquid leaving that stage. This equilibrium stage model can be represented with efficiency for each stage. The Murphree efficiency for stage number n is defined in Eq-1 as follows.
 |
(1) |
where y is the mole fraction of CO2 in the gas leaving the stage, Yn-1 is the mole fraction leaving the stage below, and y* is the mole fraction of CO2 in equilibrium with the liquid leaving the stage. Most process simulation programs have a model for applying Murphree efficiency in column modeling. Aspen HYSYS has a specific estimation method for predicting Murphree efficiency, which is based on experience with CO2 removal from high-pressure natural gas.
3.2. Operating Condition
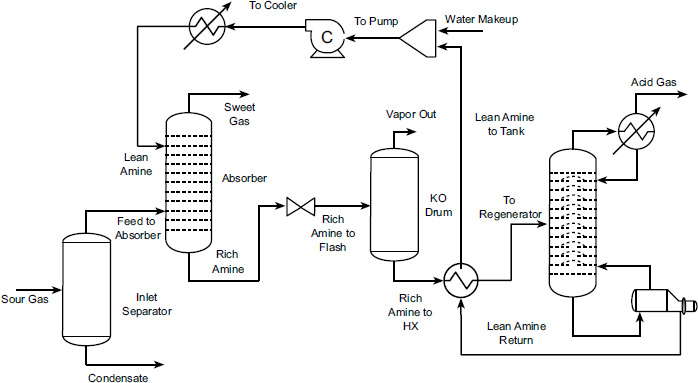
Gas streams containing a target component (e.g., CO2) are passed through an absorption column where it contacts a liquid absorbent. The target component dissolves in the liquid, effectively removing it from the gas stream. The rich absorbent (now containing the absorbed target component) is then heated or otherwise treated in a regeneration unit to release the absorbed component. This step separates the target component from the absorbent, allowing the absorbent to be recycled for reuse. The process flow diagram typically includes the main units for acid gas removal, namely the absorption column, heat exchanger, and regeneration column, as illustrated in Fig. (1).
The fixed operating conditions for the three gas fields are presented in Table 3. The remaining details will be discussed in the following section.
| Absorber | |
|---|---|
| Column pressure (kPa) | 5617 |
| Gas temperature (oC) | 38 |
| Gas pressure (kPa) | 5686 |
| Lean amine temperature (oC) | 43,33 |
| Lean amine pressure (kPa) | 5686 |
| Lean amine concentration (%mol) | 30 |
| Stripper | |
| Overhead pressure (kPa) | 110 |
| Bottomhead pressure (kPa) | 120 |
3.3. Energy and Recovery
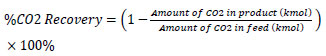
The absorber performance is represented by CO2 recovery, which indicates how much CO2 from the feed gas can be removed during the absorption process. CO2 recovery is defined as the amount of CO2 in the product gas compared to the amount of CO2 in the feed gas, as shown in the following equation 2:
 |
(2) |
In addition to CO2 recovery, energy consumption is another critical parameter for evaluating the performance of different technologies. To compare it with adsorption, it is necessary to standardize the units expressed in kJ based on a 2400-second time frame, which corresponds to the duration of the adsorption cycle. as shown in eq 3 and 4:
 |
(3) |
 |
(4) |
4. ADSORPTION SIMULATION MODEL
4.1. Pressure Swing Adsorption
Pressure Swing Adsorption (PSA) is a cyclic adsorption process primarily designed for gas separation and purification, and it is widely used for gas separation. Industrial processes typically employ more than one pair of adsorption and desorption columns operating in parallel. The Pressure Swing Adsorption (PSA) process involves multiple stages, where pressure changes within the adsorption bed, the duration of each stage, and the sequence of valve operations vary according to Hosseini and Denayer [13].
CO2 absorption process flow diagram.
First, gas flows into the adsorption column (Bed1) and increases the pressure to the desired level (PR). The process enters the adsorption stage (AD), where the second adsorption column (Bed2) contains more CO2, and the stream leaving Bed1 has a low CO2 concentration (high CH4 content). Then, part of the CH4 product is transferred to Bed2 to assist in adsorbent regeneration. After that, Bed1 becomes saturated, and Bed2 is regenerated. The process then proceeds with the depressurization equalization step (DPE), which is crucial for reducing energy consumption by minimizing gas compression. After this step, the process is repeated with the roles of the two adsorption beds reversed, as shown in Fig. (2). This basic process includes the following six steps:
1. Pressurization (PR);
2. Adsorption (AD);
3. Depressurization equalization (DPE);
4. Blowdown (BL);
5. Purging (PU);
6. Pressure equalization (PPE).
The Pressure Swing Adsorption (PSA) simulation using a dual bed, as shown in Fig. (3), was conducted using Aspen Adsorption. To represent the dual bed, the interacting single bed full flowsheet approach can be employed to simulate the complete cyclic system of interacting units. This approach is valid under the following assumptions:
- Each adsorbent layer is identical
- Only one adsorbent layer needs to be modeled accurately
- A set number of interactions can be applied
- The material transferred to the interacting bed is reused (replayed) within the cycle
4.2. Simulation Flowsheet
4.2.1. Adsorber and Adsorbent Specifications
The adsorbent material is crucial to the PSA unit. All cycle properties (operating conditions and modes) depend on the initial choice of absorbent. A study from Djeridi [15] has demonstrated that not only the micropore volume but also the structural, textural, and electrical characteristics affect CO2 adsorption capacity. Several materials can be used in PSA technology, and the selected material must meet at least one of two criteria:
- The material must have a higher selectivity for CO2. This type of material is referred to as an equilibrium-based adsorbent because its selectivity is mainly due to differences in interaction forces between CO2 and CH4 with the surface.
- Adsorbent pores can be arranged to allow CO2 (kinetic diameter 3.4 Å) to easily penetrate their structure. This material is known as a kinetic adsorbent because its selectivity is primarily due to diffusion constraints. Carbon molecular sieves (CMS) are among the most widely used materials for CO2 separation.
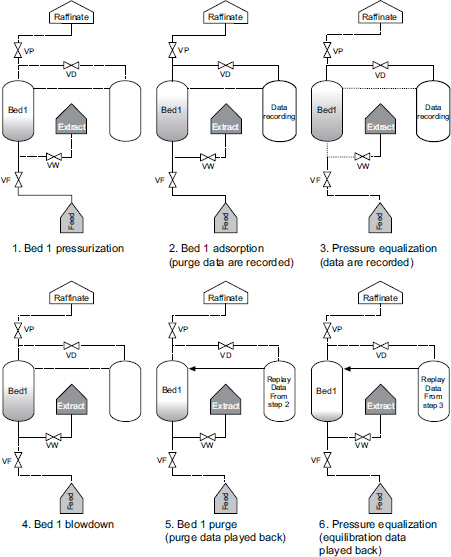
Six steps of pressure swing adsorption (PSA) cyclic according to Kottititum et al. in [14].
CO2 adsorption process flow diagram.
The adsorption equilibrium isotherms for CO2 and CH4 in CMS-3K are shown in Fig. (4). While this material clearly has selectivity for CO2, the most important property of CMS-3K is not its equilibrium selectivity, but its kinetic selectivity according to Grande [16].
Grande and Rodrigues have studied the performance of CMS-3K adsorbent in a five-step process compared to zeolite adsorbent in a four-step process. The results show that both adsorbents achieved CH4 purity above 98%, but the CH4 recovery with CMS-3K was higher than with zeolite, reaching 80% compared to 60% for zeolite. The molecular-sized pores in CMS provide high kinetic selectivity and adsorption capacity for various gases. Therefore, CMS was selected for this study based on the parameters provided in Table 4, as described by Kottititum et al. [14].
| Parameter Name | Value | Unit |
|---|---|---|
| Adsorbent bulk solid density | 715.93 | kg/m3 |
| Adsorbent particle radius | 9e-04 | m |
| Porosity | 0.33 | - |
The isotherm parameter values were obtained from experimental data by Kottititum et al. [14], and the Langmuir isotherm equation is provided in Table 5.
| Description | IP1 (x10^-6) | IP2 | IP3 | IP4 |
|---|---|---|---|---|
| CH4 | 6.31 | 1056 | 4.7e-05 | 1067 |
| CO2 | 12.7 | 1187 | 1.23e-04 | 1210 |
Mass transfer coefficients and the equilibrium adsorption model are key parameters for validating the modeling results with experimental data. In this study, the values obtained from the simulation by Kottititum et al. [14] are used, and the corresponding values can be found in Table 6, along with several other parameters.
4.3. Adsorption Isotherm
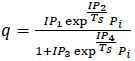
The most found in the literature is the Langmuir isotherm, which also serves as the basis for other types of isotherms. The Langmuir isotherm is one of the simplest models available to represent the interaction between adsorbent and adsorbate. The Langmuir equation (5) is given as:
 |
(5) |
Where:
• q is the adsorption capacity, in kmol/kg,
• pi is the partial pressure of the component
• qs is the maximum adsorption capacity in kmol/kg,
• b is the Langmuir parameter in bar
Various extensions and advanced versions of the Langmuir isotherm have been developed to be applied in different situations. For instance, the Extended Langmuir is often used for multicomponent systems. The Langmuir variation applied in Aspen Adsorption is provided in Table 7, where the fitting parameters are denoted with the notation IP. Further details on this equation can be found in the help section of the simulation software, according to Maksimov, [17].
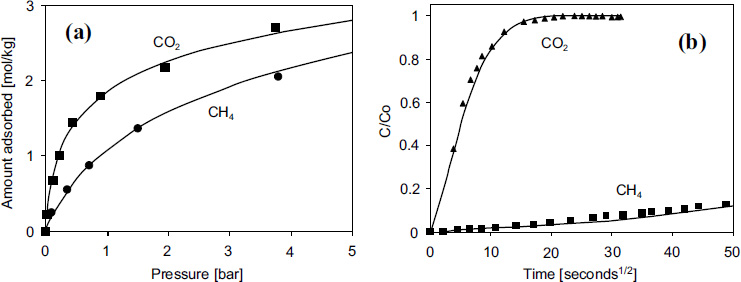
CO2 and CH4 adsorption in 3K carbon molecular sieve at 298 K: (a) adsorption equilibrium; (b) absorption rate curve according to Grande in [16]
| Parameter | Value | Unit | Description |
|---|---|---|---|
| MTC (*) | |||
| MTC (“CH4”) | 5 | 1/s | Constant mass transfer coefficients |
| MTC (“CO2”) | 110 | 1/s | Constant mass transfer coefficients |
| Dm (*) | |||
| Dm (“CH4”) | 6,70E-05 | m2/s | Molecular diffusivity |
| Dm (“CO2”) | 5,65E-05 | m2/s | Molecular diffusivity |
| Cps | 1,00E-03 | MJ/kg/K | Adsorbent-specific heat capacity |
| Cpa (*) | |||
| Cpa (“CH4”) | 0,0365 | MJ/kmol/K | Constant adsorbed phase heat capacities |
| Cpa (“CO2”) | 0,0375 | MJ/kmol/K | Constant adsorbed phase heat capacities |
| DH (*) | |||
| DH (“CH4”) | -18 | MJ/kmol | Constant for the heat of adsorption |
| DH (“CO2”) | -24,6 | MJ/kmol | Constant for the heat of adsorption |
| HTC | 1 | MW/m2/K | Constant for the heat transfer coefficient |
| Kg | 2,50E-08 | MW/m/K | Constant for the gas phase heat conductivity |
| Ks | 6,00E-07 | MW/m/K | Adsorbent thermal conductivity |
| ap | 2057,14 | 1/m | Specific surface area of the adsorbent |
| Isotherm Variation | Isotherm Equation |
|---|---|
| Langmuir 1 |
 (6) (6)
|
| Langmuir 2 |
 (7) (7)
|
| Langmuir 3 |
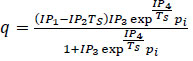 (8) (8)
|
| Extended Langmuir 1 |
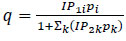 (9) (9)
|
| Extended Langmuir 2 |
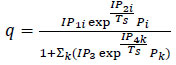 (10) (10)
|
| Extended Langmuir 3 |
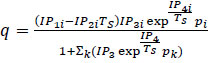 (11) (11)
|
4.4. Mathematic Model
In this study, the Peng-Robinson model was selected due to its suitability for non-ideal gas phases and its widespread use in CO2/CH4 separation via the PSA (Pressure Swing Adsorption) technique according to Kottititum et al. [14]. Meanwhile, the adopted momentum balance is based on the Ergun equation 12, which is expressed as follows:
 |
(12) |
In this study, the Extended Langmuir 2 model was used, expressed as a function of the partial pressures of various components, as presented in Aspen Adsorption, and capable of accounting for temperature dependence. Meanwhile, the energy equilibrium model used is the non-isothermal model with gas and solid conduction Kottititum et al. [14].
In this case, a lumped resistance model with a linear form was chosen, which simplifies the analysis by considering only one resistance per component. Therefore, as previously mentioned, the analysis was simplified by using a single kinetic parameter for CH4 and CO2. This kinetics model was adjusted using the linear driving force model, which is commonly applied in kinetic studies shown in eq 13.
 |
(13) |
4.5. Cycle Organizer
To create a cyclically operated process, a tool called Cycle Organizer can be used in the simulation with Aspen Adsorption. In this study, it is necessary to set the time for each stage (control variable), as shown in Table 8.
| Step | Duration (s) |
|---|---|
| Adsorption | 40 |
| Depressurization | 10 |
| Blowdown | 10 |
| Purge | 40 |
| Repressurization | 10 |
| Pressurization | 10 |
In addition to setting the time in the Cycle Organizer, manipulated variables must also be specified. These variables include the valve opening and closing settings, as well as the valve specifications. The valve operation schedule is arranged using the numbering system, as shown in Table 9.
| Step | Position |
| 0 | Fully closed valve (flow rate through the valve is always zero) |
| 1 | Fully open valve (flow rate through the valve will be determined by mass balance) |
| 2 | Flow rate through the valve will have a linear relationship with pressure drop |
| 3 | Valve will have a constant flow rate |
4.6. Energy and Recovery
The performance of the adsorber is represented by CO2 recovery, which indicates how much CO2 from the feed gas can be removed during the adsorption process. CO2 recovery is defined as the amount of CO2 in the product gas compared to the amount of CO2 in the feed gas, as shown in the following equation:
 |
(14) |
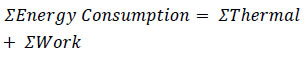
In addition to CO2 recovery, which is a key performance parameter in this experiment, energy consumption is also an important parameter for evaluating the effectiveness of the technology.
| Energy Consumption = ΣThermal + ΣWork | (15) |
| ΣEnergy Consumption (kJ) = (ΣCooler) + (ΣCompresor) | (16) |
5. RESULTS AND DISCUSSION
5.1. Absorption using Aspen HYSYS
This flowsheet is used to simulate data from the three gas fields involved in the study, as shown in Fig. 5. However, adjustments in pressure and temperature are made before the gas enters the absorber column, which is designed for a pressure of 51 bar and a temperature of approximately 40°C. Although the flowsheet for the three gas fields appears similar, the design specifics, such as the number of trays and the solvent used, will be adjusted according to the conditions of each field to achieve recovery values comparable to those of other technologies, such as adsorption. Additionally, it is crucial to ensure that the temperature of the liquid product from the absorber, which contains MEA, does not exceed 120°C to prevent degradation.
With varying CO2 compositions in the three gas fields, adjustments are made to the absorber operating conditions, such as the number of trays and the amount of solvent for each field, as shown in Table 10. There is a relationship between CO2 concentration, solvent amount, and the outlet temperature of the amine (rich amine). Since the reaction between CO2 and amine solvent is exothermic, a higher CO2 concentration leads to a higher temperature of the product exiting the absorber. This can be mitigated by increasing the amount of solvent, which lowers the outlet temperature of the absorber. As explained, the temperature of the rich amine must be maintained around 120°C to prevent degradation. For more details, the operating conditions of the absorber and stripper are provided in Table 10.
Before applying the model to scenarios with relevant CO2 concentrations, a preliminary simulation based on the work of Wang et al. [18] was conducted to validate the assumptions outlined earlier. Wang et al. [18] studied CO2 absorption using MEA and validated their model using real operational data.
After making several adjustments, the CO2 recovery values achieved are as follows: for the Masela field, CO2 recovery is 93% with CH4 purity at 99%; for the JTB field, CO2 recovery is 95.43% with CH4 purity at 97.24 mol%; and for the Natuna field, CO2 recovery is 93.68% with CH4 purity at 85.2 mol%. From the absorption process, the energy consumption is detailed in Table 11. The highest energy usage is observed in the condenser and reboiler, which are part of the stripper. As the separation process in the stripper becomes more efficient and the amount of solvent increases, the energy consumption also rises.
| Absorber | Masela | JTB | Natuna |
|---|---|---|---|
| Number of tray | 20 | 18 | 17 |
| Solvent (kmol/h) | 61195 | 68540 | 881200 |
| Rich Amine temperature (°C) | 121.8 | 117 | 123 |
| Rich Amine pressure (kPa) | 5617 | 5617 | 5617 |
| Sweet Gas temperature (°C) | 45.37 | 45.37 | 44.34 |
| Sweet Gas pressure (kPa) | 5617 | 5617 | 5617 |
| Stripper | |||
| Number of trays | 10 | 10 | 8 |
| Reboiler temperature (°C) | 175 | 175 | 175 |
| Condenser temperature (°C) | 98 | 98 | 98 |
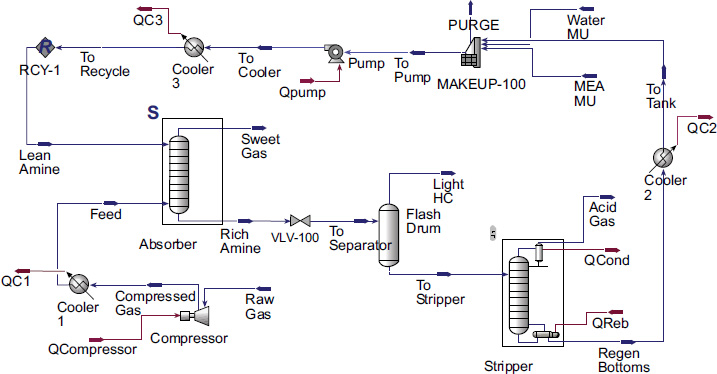
CO2 absorption process flow diagram in ASPEN HYSYS.
| Energy (kJ) | Reboiler | Condenser | Pump | Cooler 1 | Cooler 2 | Cooler 3 |
|---|---|---|---|---|---|---|
| Masela | 1.73E+10 | 1.89E+10 | 9.79E+06 | 1.31E+08 | 1.68E+08 | 3.56E+08 |
| JTB | 1.93E+10 | 2.12E+10 | 1.10E+07 | 4.57E+07 | 1.88E+08 | 3.99E+08 |
| Natuna | 2.46E+11 | 2.70E+11 | 1.41E+08 | 4.71E+07 | 2.42E+09 | 5.12E+09 |
5.2. Adsorption using Aspen Adsorption
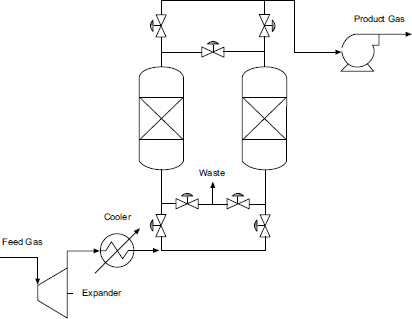
In the simulation, a PSA approach with a single bed is used, as shown in Fig. 6, with the composition and flow rates adjusted according to the natural gas conditions produced by each field. In the PSA cycle, adsorption occurs at a pressure of 10 bar, while purging takes place at a pressure of 6 bar.
In this study, a single PSA cycle using dual beds consists of 6 steps controlled by valves. These valves can be adjusted using the Cycle Organizer, with specifications provided in Table 12. The use of these 6 steps is expected to help reduce energy consumption.
The adsorption simulation is conducted by dividing the feed gas flow rate, as in real-world applications where adsorption is arranged in parallel with multiple pairs of PSA beds. The recovery value in the adsorption process is influenced by several factors, such as the type of adsorbent and the duration of adsorption. Longer adsorption durations result in greater CO2 absorption by the adsorbent; however, there is a limit to the adsorbent's capacity to absorb CO2 due to saturation levels. Further information about the operating condition of the adsorption column is shown in Table 13.
To ensure the accuracy of the assumptions described above, a preliminary simulation was conducted for validation before applying the model to scenarios with relevant CO2 concentrations. The validation is based on the work of Kottititum [14], which investigated adsorption for biogas purification and validated their model using real operational data.
Before entering the adsorption bed, the feed gas undergoes pretreatment to reduce the temperature and pressure to 25°C and 10 bar. The total energy consumed during the PSA process to achieve CO2 recovery values of 93% for the Masela field, 95.15% for the JTB field, and 93.06% for the Natuna field is noted. The energy required for regeneration in this process is significantly lower compared to solvent regeneration in absorption, as shown in Table 14. This value will increase with higher CO2 absorption and when aiming for higher recovery values.
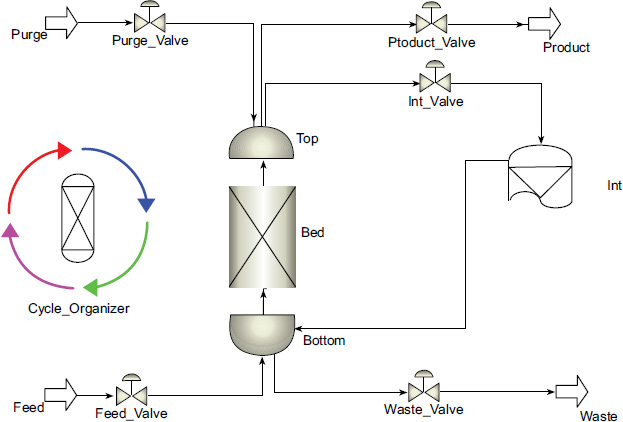
CO2 adsorption process flow diagram in aspen adsorption.
| Step | Function | Valve | ||||
|---|---|---|---|---|---|---|
| Feed | Product | Int | Waste | Purge | ||
| Step 1 | Absorption bed 1, purge bed 2 | 3 | 1 | 0 | 0 | 0 |
| Step 2 | DPE bed 1, RPE bed 2 | 0 | 0 | 2 | 0 | 0 |
| Step 3 | Blowdown bed 1, pressurization bed 2 | 0 | 0 | 0 | 2 | 0 |
| Step 4 | Purge bed 1, adsorption bed 2 | 0 | 0 | 0 | 1 | 3 |
| Step 5 | RPE bed 1, DPE bed 2 | 0 | 0 | 2 | 0 | 0 |
| Step 6 | Pressurization bed 1, blowdown bed 2 | 2 | 0 | 0 | 0 | 0 |
| Step |
Pressure (bar) |
Temperature (°C) | Energy (kJ) |
|---|---|---|---|
| Adsorption | 10 | 25 | W=nR(T1)ln(P1/Pfeed) |
| Depressurization | 10 to 5 | 25 to 12 | 0 (conserves by equalizing) |
| Blowdown | 5 to 1 | 12 to (-7) | W=nR(T2)ln(P3/P2) |
| Purge | 1 | (-7) | W=nR(T3)ln(Ppurge/P3) |
| Repressurization | 1 to 5 | (-7) to 10 | 0 (conserves by equalizing) |
| Pressurization | 5 to 10 | 10 to 25 | W=nR(T5)ln(P6/P5) |
5.3. Energy Comparison of Absorption and Adsorption for Each Field
From the simulation results of CO2 separation for the Masela, Jambaran Tiung Bitu, and Natuna gas fields, it is observed that adsorption technology performs better in terms of energy consumption compared to absorption technology, as shown in Table 15. These findings are supported by Zanco et al. [7], who stated that among absorption, adsorption, and membrane technologies for a 12% CO2 feed, absorption has higher energy consumption. However, this comparison is based solely on energy consumption, and the results may differ when considering the costs associated with both technologies. According to Zanco et al. [7], while adsorption offers lower energy consumption and can handle relatively high CO2 concentrations, its application is typically limited to small-scale plants. In contrast, absorption, despite its higher energy consumption, has been proven effective in several large-scale plants. Therefore, it is important to note that a comprehensive evaluation should also include cost analysis, which will be addressed in future work.
Table 15 also shows that although the Masela field has a CO2 concentration of 10% and a flow rate of 1200 MMSCFD, and the JTB field has a CO2 concentration of 35% and a flow rate of 340 MMSCFD, the energy consumption for CO2 separation from natural gas in both fields can be similar. This is due to the total mass of CO2 that needs to be removed from the gas stream being nearly identical in both fields. The Masela field, despite having a lower CO2 concentration, processes a significantly larger gas volume, resulting in a substantial total mass of CO2. Conversely, the JTB field, with a higher CO2 concentration but a lower flow rate, also produces a comparable total mass of CO2. Thus, the energy required for CO2 separation in both fields is almost the same despite differing operational conditions and CO2 concentrations.
5.4. Effects of CO2 Concentration, Pressure, and Temperature
The three gas fields used in this study exhibit different operating conditions in terms of CO2 concentration, temperature, flow rate, and pressure. However, among these four variables, CO2 concentration has the most significant influence on determining the CO2 separation technology. Therefore, an analysis was conducted to assess the impact of CO2 concentration on the separation performance (recovery) of the absorber and adsorber.
To ensure a fair comparison, simulations were performed with the same flowrate, pressure, and temperature for all three fields. The selected conditions were a flowrate of 340 MMSCFD, pressure of 51 bar, and temperature of 40°C. Additionally, the operating conditions of each piece of equipment within the CO2 separation unit were kept constant, ensuring that the energy consumption across the fields remained comparable. This approach provides a clearer understanding of how varying CO2 concentrations influence the performance of both absorption and adsorption processes.
On the other hand, from the absorber simulation using Aspen Adsorption, the performance of the absorber for the three fields is shown in Fig (7). It was concluded that the adsorber performed best in the JTB field with a gas concentration of 35%. For the Masela gas field with 10% CO2, the performance was the lowest, followed by the Natuna gas field with 71% CO2. This is due to the characteristics of the adsorbent, which has an optimal capacity at medium concentrations, like in the JTB field.
| Energy (kJ) | Feed Cooler | Compressor PSA | Total |
|---|---|---|---|
| Masela | 1.97E+08 | 3.43E+09 | 3.63E+09 |
| JTB | 1.38E+09 | 5.44E+07 | 1.43E+09 |
| Natuna | 1.36E+10 | 1.10E+08 | 1.37E+10 |
| Field | %CO2 | Temperature | Pressure | Flowrate | CO2 recovery | Energy Consumption (kJ) | ||
|---|---|---|---|---|---|---|---|---|
| Absorption | Adsorption | Absorption | Adsorption | |||||
| Masela | 10,23 | 103 (°C) | 51 bar | 1200 MMSCFD | 93% | 93% | 2,46E+10 | 3,63E+09 |
| JTB | 36,85 | 100 (°C) | 42 bar | 340 MMSCFD | 95,43% | 95,15% | 2,75E+10 | 1,43E+09 |
| Natuna | 72,54 | 40 (°C) | 68 bar | 2353 MMSCFD | 93,68% | 93,06% | 3,49E+11 | 1,37E+10 |
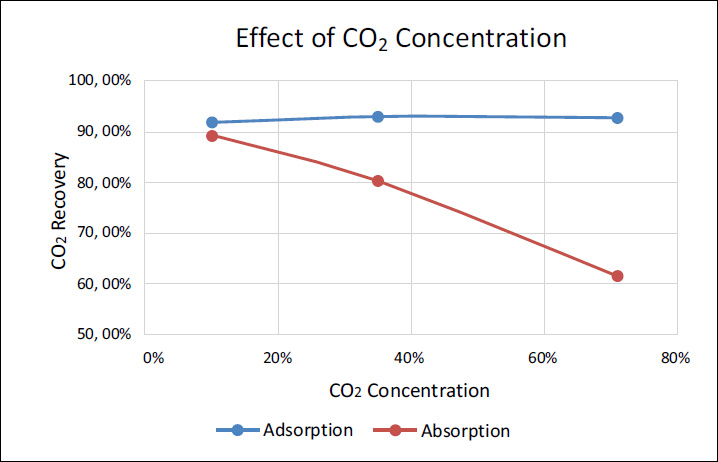
CO2 concentration effect on absorption and adsorption performance.
At low concentrations, such as in the Masela field, the adsorbent does not work as efficiently because there is insufficient gas to reach optimal saturation. Meanwhile, at very high concentrations, such as in the Natuna field, the adsorbent quickly reaches its saturation point, reducing the efficiency of further CO2 absorption. This highlights how the performance of the adsorber is strongly influenced by the concentration of CO2, with mid-range concentrations providing the best balance between adsorption efficiency and gas availability.
To validate the results of the CO2 separation technologies, the simulation outcomes were compared with previous studies and experimental data. The effect of CO2 concentration on recovery rates in absorption and adsorption processes was evaluated against comparable studies by Mustafa et al. [19] for the absorption study and Kottititum et al. [14] for the adsorption study, which reported consistent trends.
CONCLUSION
In this study, simulations were conducted for carbon separation from the Masela, Jambaran Tiung Biru (JTB), and Natuna gas fields using absorption technology with Aspen HYSYS and adsorption technology with Aspen Adsorption. CO2 separation in the Masela, JTB, and Natuna gas fields was found to be more suitable using adsorption technology due to its superior energy performance compared to absorption. For both technologies at Masela field with 93% recovery, energy consumption for absorption was 2.46E+10 kJ, and for adsorption, it was 3.63E+09 kJ. At JTB with 95% recovery, absorption and adsorption consumed 2.75E+10 kJ and 1.43E+09 kJ, respectively. Meanwhile, at Natuna, with 93% recovery, absorption and adsorption consumed 3.49E+11 kJ and 1.37E+10 kJ, respectively. This research also highlighted that CO2 concentration is the most influential variable in CO2 separation, compared to temperature, pressure, and flowrate, which can be adjusted through pre-treatment. Aspen HYSYS simulations showed that absorber performance decreases with increasing CO2 concentration due to mass load and rapid solvent saturation. Conversely, Aspen Adsorption simulations revealed that adsorbers work optimally at medium concentrations (35% CO2) like in the JTB field. Low concentrations (10% CO2) in the Masela field do not reach optimal saturation, and high concentrations (71% CO2) in the Natuna field cause rapid saturation of the adsorbent, reducing adsorption efficiency.
AUTHORS’ CONTRIBUTIONS
The authors confirm their contribution to the paper as follows: Study conception and design were contributed by R.R. and J.J.; and the manuscript was drafted by T.N.A. All authors reviewed the results and approved the final version of the manuscript.
LIST OF ABBREVIATIONS
| CH4 | = methane |
| CO2 | = carbon dioxide |
| H2S | = hydrogen sulfide |
| H2O | = water |
| N2 | = nitrogen |
| PSA | = Pressure Swing Adsorption |
| DPE | = Depressurization equalization step |
| BL | = Blowdown |
| PU | = Purging |
| PPE | = Pressure equalization |
| CMS | = Carbon molecular sieves |
AVAILABILITY OF DATA AND MATERIALS
The data and supportive information are available within the article.
FUNDING
This work was funded by [KEMENDIKBUDRISTEK] under the Hibah Penelitian Disertasi Doktor (PDD) [number 038/E5/PG.02.00.PL/2024] or [DRPM Institut Teknologi Sepuluh Nopember][number 1719/PKS/ITS/2024], Indonesia.
ACKNOWLEDGEMENTS
Declared none.